Portfolio View
Part of Project portfolio management
Comparing portfolio dashboards with individual project reports
See which decisions a portfolio dashboard and an individual project report each support, and how to trace a summary to its source.
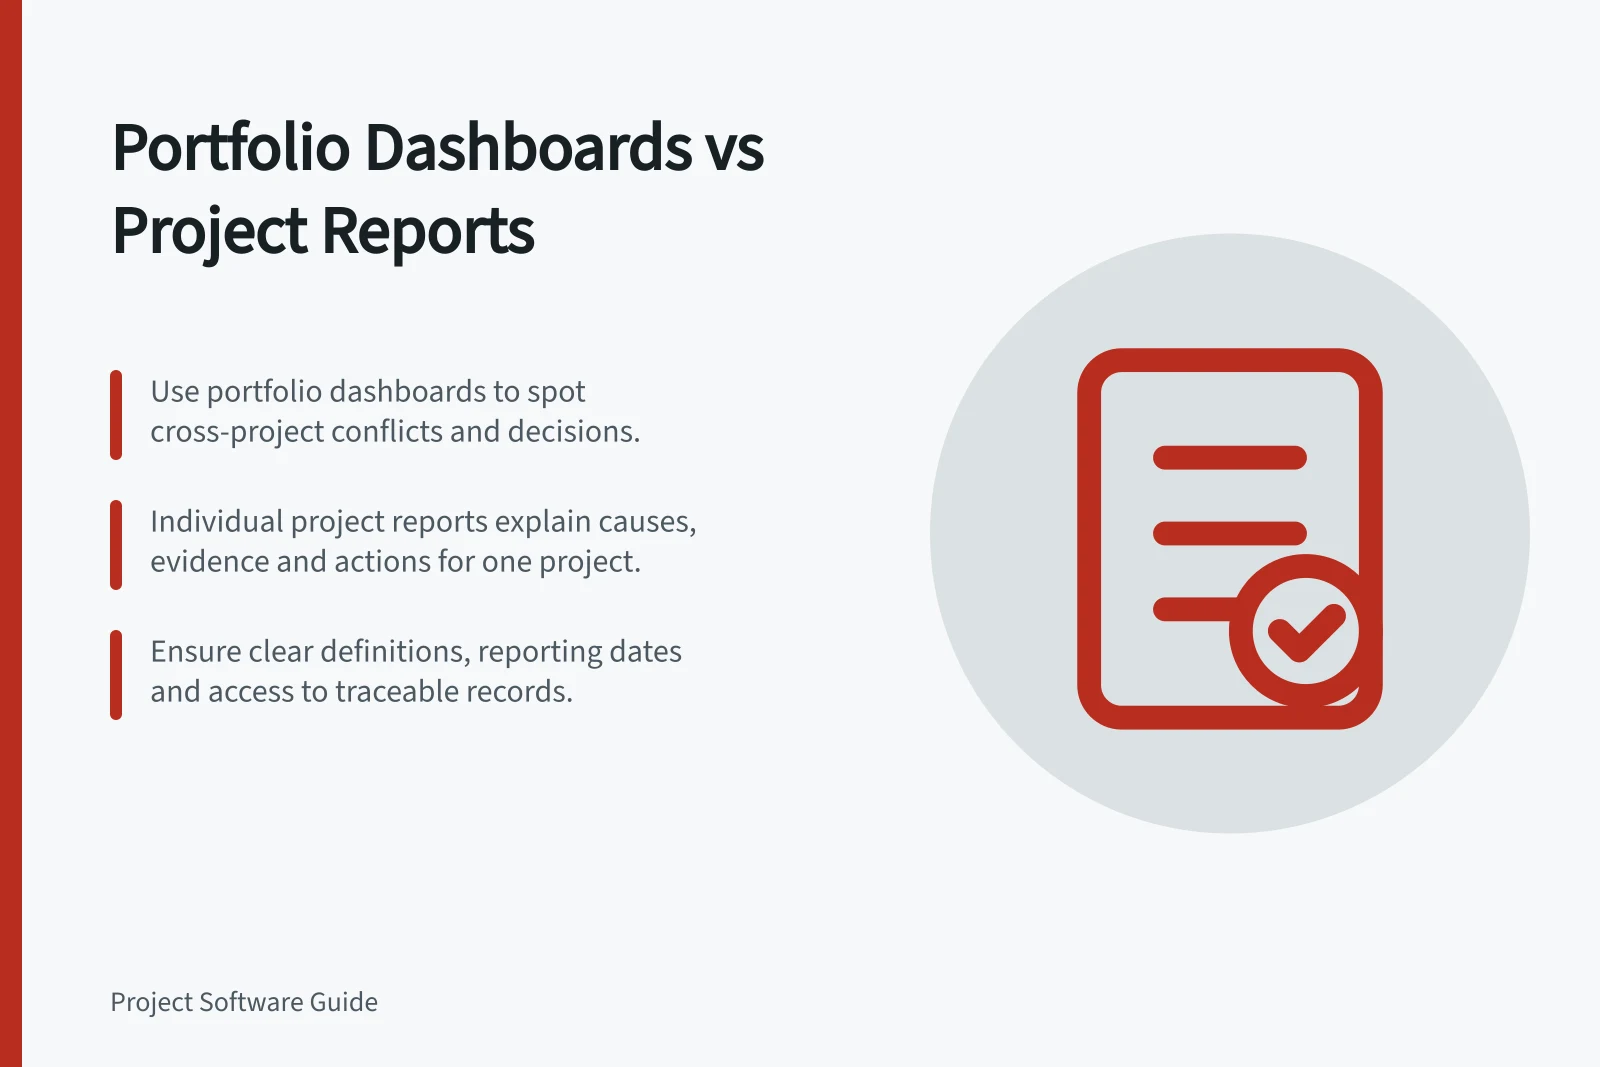
Use a portfolio dashboard to identify decisions and competing demands across projects. Open an individual project report to understand one project's evidence, cause and proposed action. Neither view is dependable unless its included work, definitions and reporting date are clear.
Start with the question
| Portfolio dashboard | Individual project report |
|---|---|
| Which projects need a portfolio decision? | What changed in this project, and why? |
| Where do dates, funding or people compete? | Which deliverable or milestone is affected? |
| Is an exposure shared across projects? | How does it affect this project, and what is its owner doing? |
| Which updates are missing? | What evidence supports this project’s latest status? |
Comparable fields let a dashboard reveal a pattern, though it may not explain every status. A project report can explain a changed forecast, but on its own may not reveal a clash with other projects.
Portfolio Dashboard vs Individual Project Report: Key Differences and Use Cases
- PurposeIdentify cross-project decisions, competing demands, shared exposures, and missing updates across multiple projects.
- FocusDeep dive into one project’s status, causes of change, evidence, and next actions.
- Decision SupportSupports strategic portfolio-level decisions (e.g., resource allocation, prioritisation).
- Detail LevelHigh-level overview with aggregated data; lacks granular project-specific context.
- TraceabilityRequires clear definitions, reporting dates, and links to source reports for credibility.
Advantages and Limitations of Each View
- Portfolio Dashboard – Pros
- Reveals patterns, conflicts, and priorities across projects; supports high-level decision-making.
- Portfolio Dashboard – Cons
- May obscure root causes; unreliable if statuses are inconsistently defined.
- Individual Project Report – Pros
- Provides detailed evidence, ownership, and rationale for changes; supports accountability.
- Individual Project Report – Cons
- Can miss cross-project impacts; may not reveal broader strategic implications.
Keep the summary traceable
Choose portfolio fields that support actual decisions: project owner, approval state, current forecast, significant change, shared dependency, decision needed and last update. Define status labels before counting them. If project leads use different meanings for “at risk”, a combined count is misleading.
Show the reporting cut-off, included projects and filters. A view of active projects may omit paused work; access permissions can also affect what a person sees. Treat an empty field as missing information until checked.
For each item needing attention, make the underlying project record or report easy to find. The project report should identify the agreed reference plan, current forecast or actual result, explanation, owner and next action. Preserve dated reports used for decisions so a later update does not obscure what was known at the time.
Key Fields to Include in Portfolio Dashboards
- Project Owner
- Clear accountability for each project.
- Approval State
- Indicates current governance status (e.g., approved, pending, rejected).
- Current Forecast
- Latest delivery date or cost estimate.
- Significant Change
- Highlights material deviations from baseline.
- Shared Dependency
- Flags inter-project risks or constraints.
Compare the views with one change
Imagine two hypothetical projects forecasting a delay. In Project A, a client review moves, with no known effect elsewhere. In Project B, a late handover also delays another project.
The dashboard should expose the cross-project consequence. Each project report should explain its own dates, cause and response. Adding the two delays into one total would hide that difference.
When evaluating software, ask a provider to show a changed milestone in both views. Check which projects enter the summary, what an intended user can see on the relevant plan and permissions, and whether the source explanation remains available.
These capabilities vary by product and configuration. For a decision about shared capacity, begin with the portfolio view and inspect the affected reports. For a decision about one deliverable, begin with its project report and raise any cross-project consequence.
How to Evaluate a Change in Both Views
- Identify the changeIn Project A, a client review is delayed. In Project B, a handover delay affects another project.
- Check portfolio dashboardVerify if the delay impacts shared resources, timelines or dependencies across projects.
- Review individual project reportConfirm the cause, forecast impact, owner, and planned response for the affected deliverable.
- Avoid misleading aggregationDo not combine delays into a single total—this hides critical differences in impact.
- Validate traceabilityEnsure the source report and reference plan are accessible and preserved for audit purposes.